AidData · William & Mary · Karachi, Pakistan · 2025
Pakistan data journalism training
A blended programme for working journalists: an online course, a week-long in-person workshop and a data investigation simulation, evaluated before, during and after delivery.
2.8 → 4.0Self-rated skill in finding reliable data (1–5)
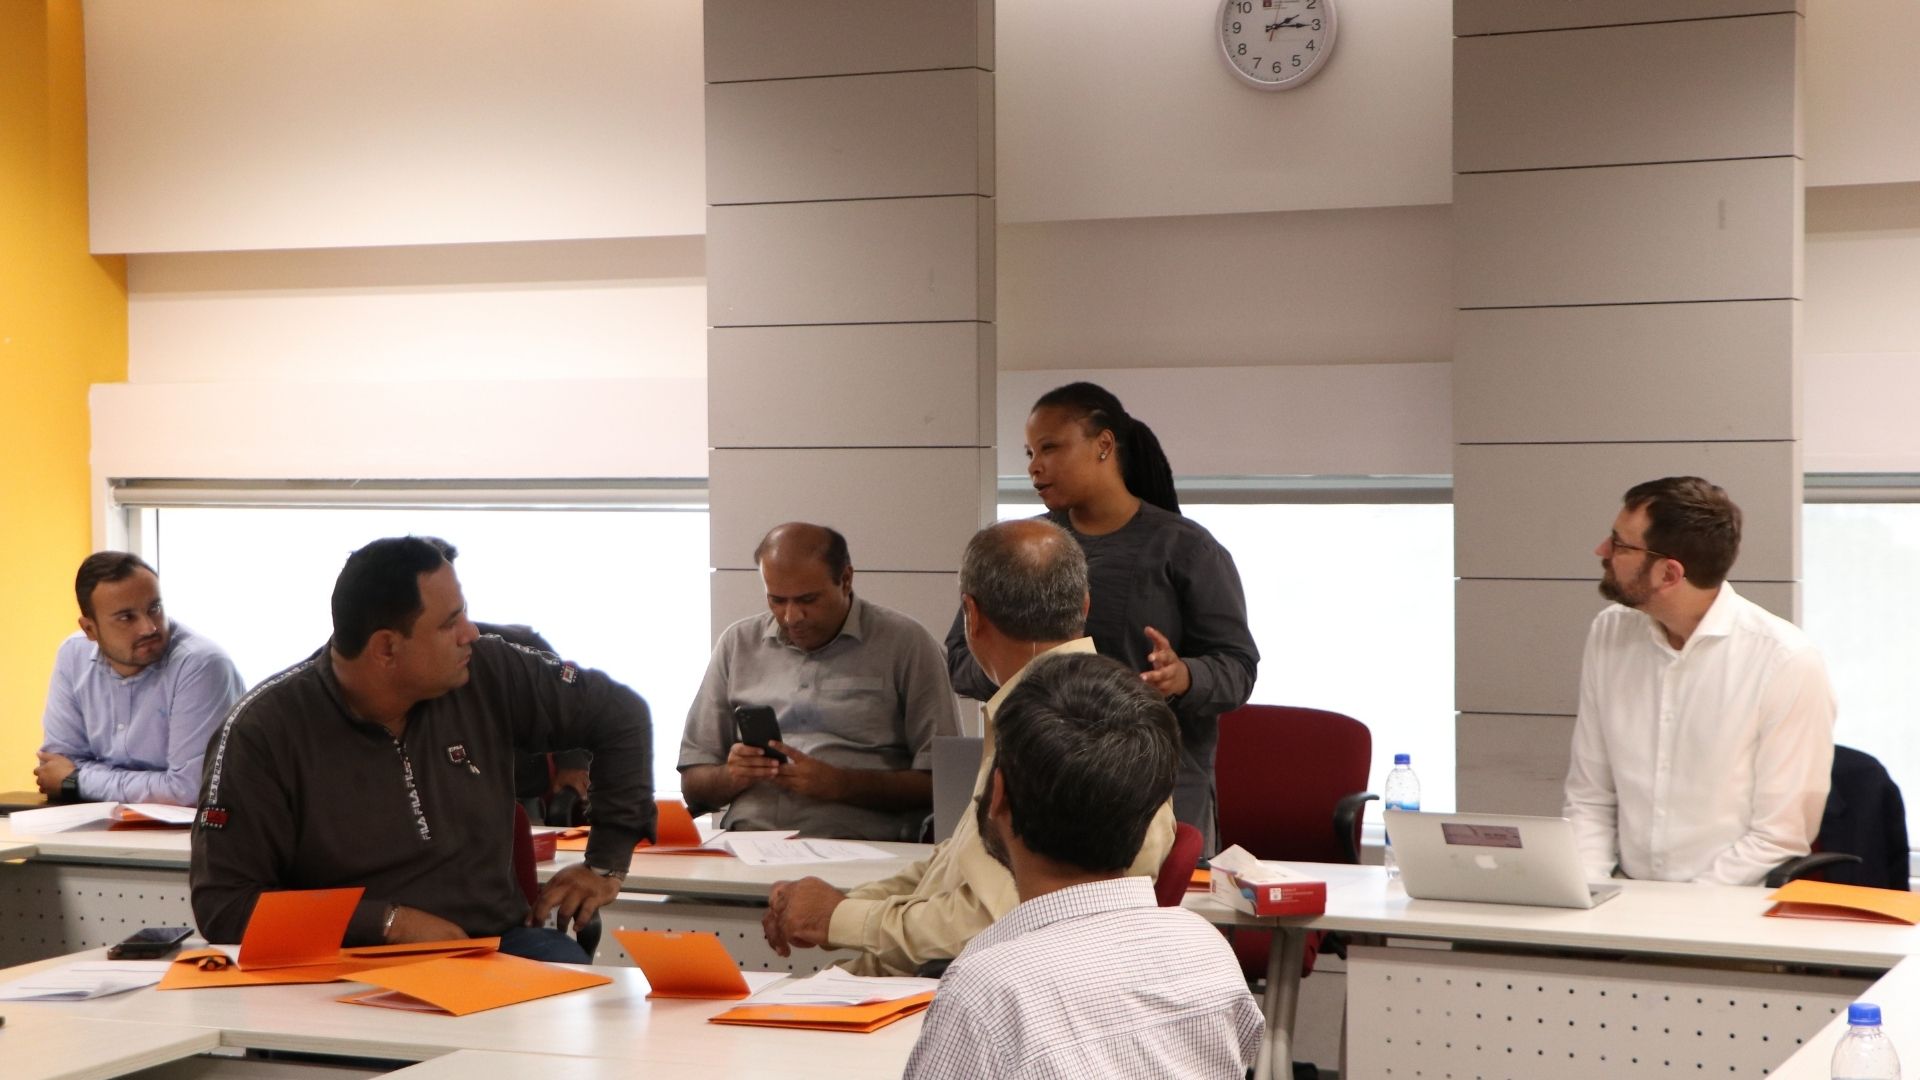
The Missing Classrooms in session during the in-person week, Karachi, July 2025.
Learners and need
Who the learners were
Working journalists across digital, print, television, radio and freelance media. Most applicants rated their data skills as beginner or no experience; 56% of the cohort worked in digital media and 56% already had some economic reporting experience.
What the baseline showed
A pre-training survey found the barriers were access and verification rather than motivation: 72% lacked access to reliable data, 64% struggled to verify information and 56% had limited access to expert sources. 80% wanted access to new data sources.
My ownership
Instructional design lead for the programme. Designed and developed the content of the online course, Navigating Global Development Finance; conceptualised and built the AidData Training Hub that delivers it; designed and delivered The Missing Classrooms simulation during the in-person week. As training lead, I own the work plans, monitoring and evaluation, and quarterly reporting to the U.S. Department of State.
From design to delivery
Online course
Four modules: Data Foundations, Data Journalism, Data Analysis & Visualization, and International Development Finance & Credit Provision, each closing with a quiz, followed by a capstone project. Participants averaging above 75% earn a Data Journalism digital badge. Average quiz results ranged from 65% to 95% across the four modules.
Partnership and credential
The course is delivered in partnership with William & Mary’s Studio for Teaching & Learning Innovation. Graduates receive a William & Mary completion credential administered through the Studio and issued as a digital badge on Credly.
A data investigation exercise built on a fictional school-construction programme. Five teams (community impact, construction oversight, financial crimes, geographic justice and procurement) analyse their own datasets, then combine findings into one story. A facilitator memo and quick-reference guide set out the key calculations each team should reach.
Simulation title card, in English and Urdu.
Measurement
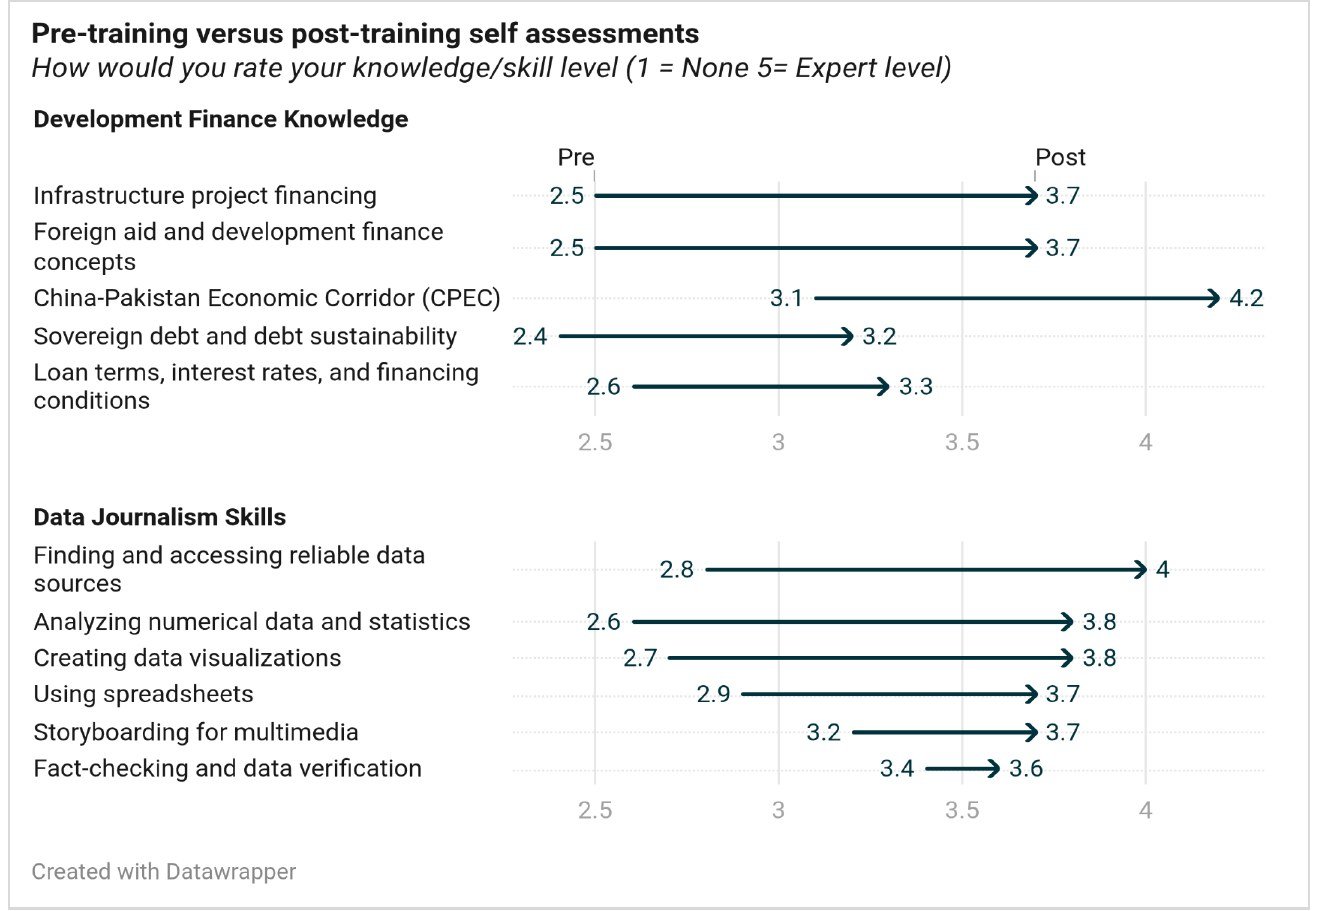
Pre-, mid- and post-training surveys alongside module quizzes. Self-rated gains included analysing numerical data (2.6 to 3.8), creating data visualizations (2.7 to 3.8) and infrastructure project financing (2.5 to 3.7). These are self-ratings and quiz results, not independently measured workplace outcomes.
The evidence
Before, during and after.
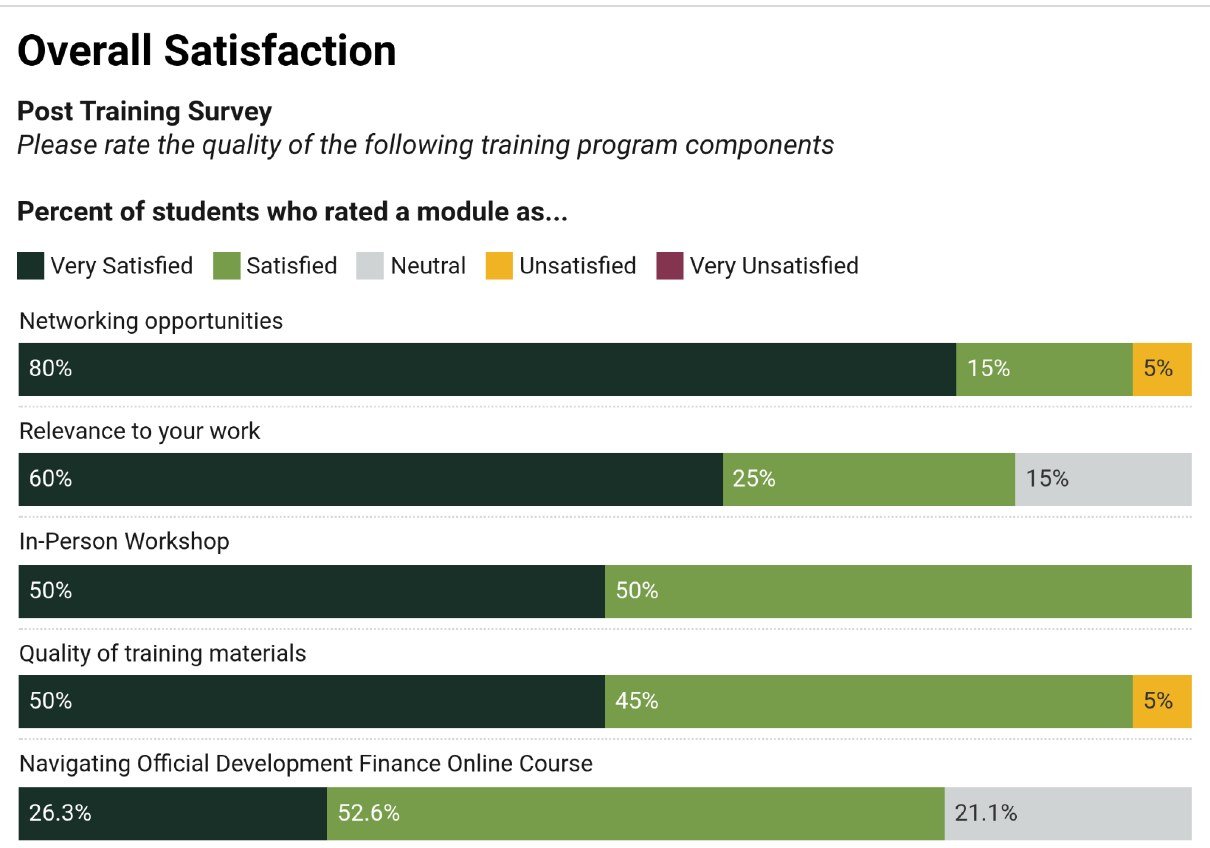
Charts from the cohort’s pre- and post-training surveys. All figures are anonymous cohort totals.
Self-assessed knowledge and skills before and after training (1 = none, 5 = expert).
Satisfaction by programme component, post-training survey.
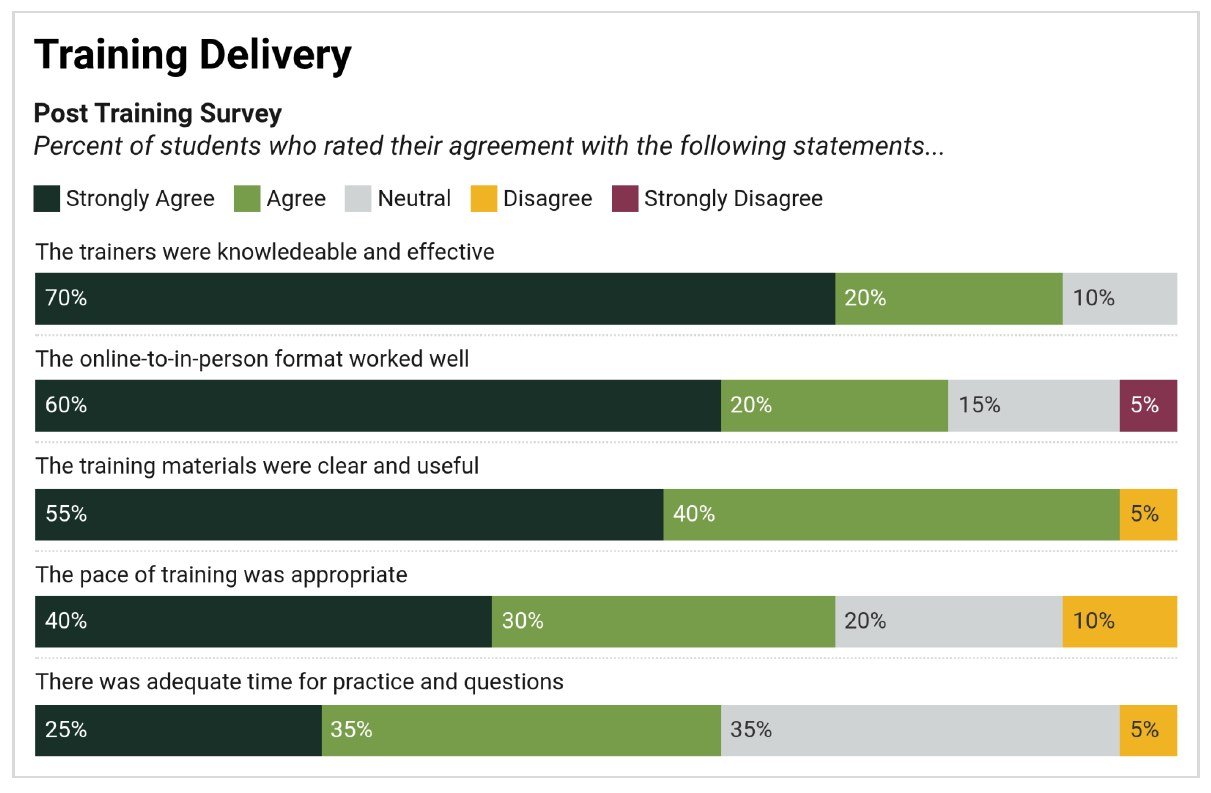
Agreement with statements about delivery, post-training survey.
Evaluation into redesign
What the evidence pointed to.
The post-training survey was positive overall. Its weaker results were the most useful: they point to four design changes for subsequent cohorts, while peer review and reporting close the loop.
01
Build in practice time
90% agreed the trainers were knowledgeable and effective, but only 60% agreed there was enough time for practice and questions. More hands-on practice was the most common request.
02
Rebalance the online load
All respondents were satisfied with the in-person workshop, against 78.9% for the online course. Participants said the online modules were long for the time available.
03
Strengthen data analysis
The Data Analysis & Visualization module drew the most dissatisfaction (17.7% unsatisfied) and the lowest quiz average (65%).
04
Extend support after the workshop
Of 24 respondents, 19 asked for follow-up webinars, 18 for a peer learning network, 16 for story grants and 15 for mentorship.
05
Test designs with peers
I demoed the programme's government-official simulations to the W&M Instructional Design Collab. Their feedback targeted outcome alignment, usability for participants at any level of digital skill, and more explicit orientation beyond built-in glossaries and onboarding.
06
Report and iterate
Survey and quiz results go into quarterly reporting and feed the design of the Islamabad and Lahore cohorts.