Sethu Nguna.
AidData · IBA CEJ · Karachi, Pakistan · 2025

The Missing Classrooms

Designed, built & delivered

A whistleblower leaks the files on a school-building programme that promised every child a classroom. Five teams of journalists each get one part of the evidence. The story only comes together when they combine it.

← Explore all projects
Learners
A mix of experienced and student journalists from Karachi and surrounding areas
Setting
The in-person week of AidData’s Pakistan data journalism programme, Karachi, July 2025
Format
Facilitated; five specialist teams; four timed parts of about an hour in total
Built with
HTML, CSS and vanilla JavaScript; JSON team datasets; runs in a browser
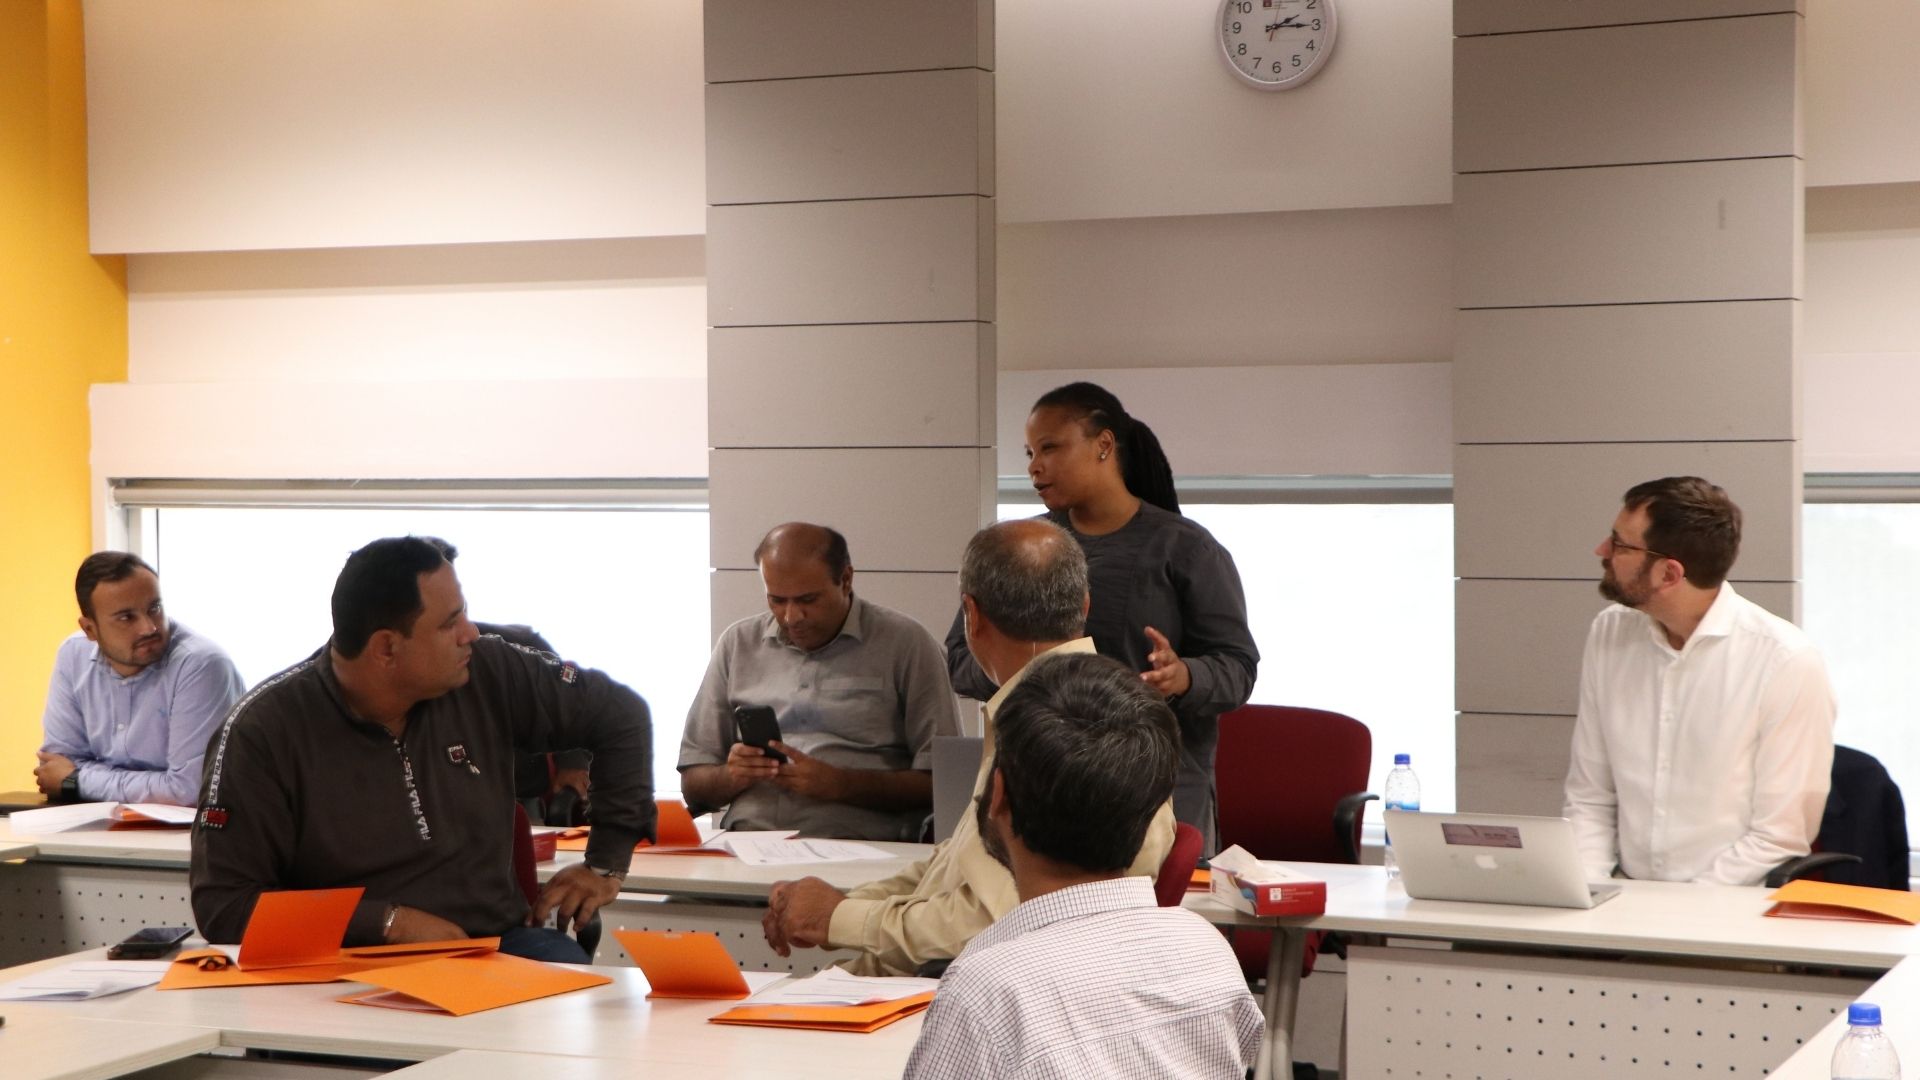
Journalists working through The Missing Classrooms simulation at the Karachi workshop
The Missing Classrooms in session during the in-person week, Karachi, July 2025.
The design problem

The challenge

The programme’s pre-training survey showed the barrier wasn’t motivation. It was getting from data to a story that holds up: 72% of the cohort lacked access to reliable data and 64% struggled to verify information. This session also brought students and experienced reporters into the same room, so the exercise had to stretch both.

The logic

Split the evidence so that no team can see the whole story. Each team works its own dataset and calculates the ratios that matter, then combines its findings with the other four. The fiction removes the risk of a real investigation. The official denial and the missing records keep the pressure of one.

What teams produce

A joint briefing: the core problem, the evidence behind it, the impact on children, what is still missing and what accountability would require.

My role

I designed the scenario, the five team datasets and the facilitator materials, built the browser-based desktop, and facilitated the session in Karachi.

Inside the simulation
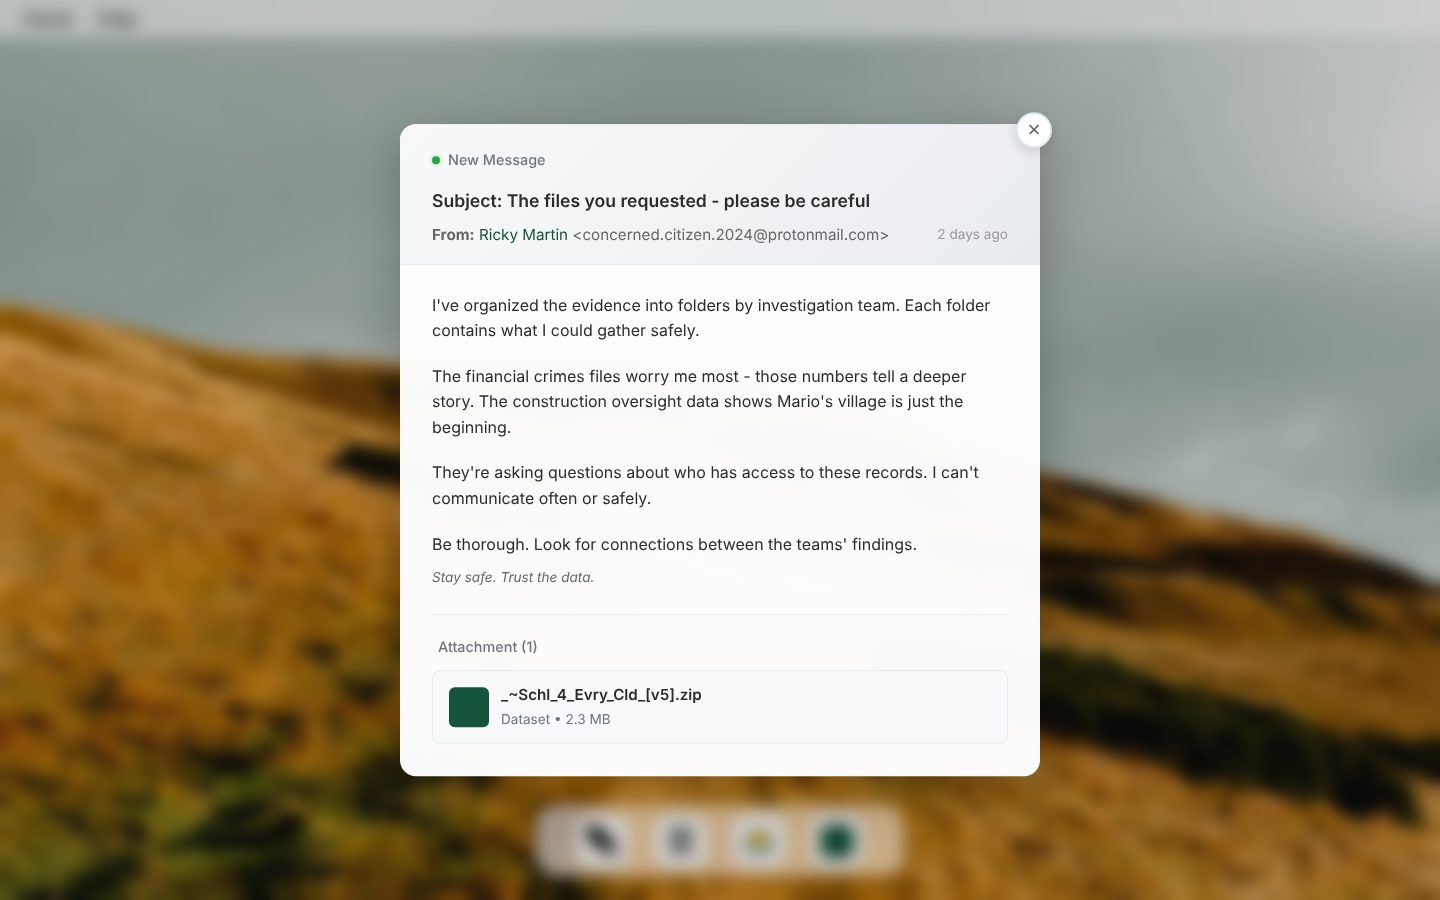
Simulated email from the whistleblower Ricky Martin, asking teams to look for connections between their findings, with an attached dataset
The whistleblower’s first email gives a lead and a warning, not an answer.
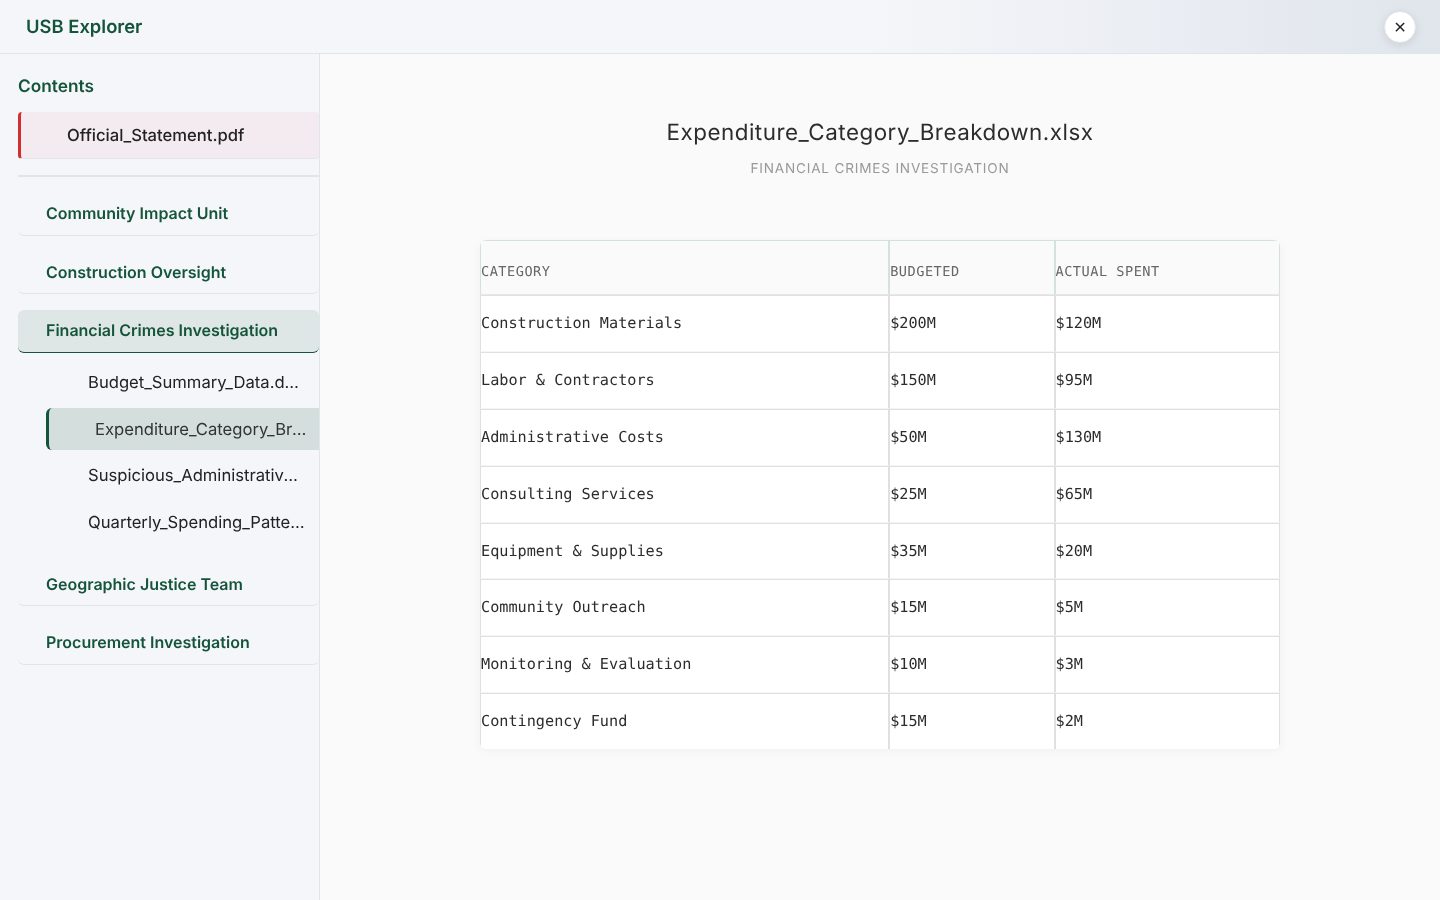
Expenditure breakdown open in the USB Explorer, showing administrative costs budgeted at $50M and $130M actually spent
Financial Crimes evidence: administration was budgeted at $50M and cost $130M, more than was spent on construction materials.
How a session runs

Brief, investigate, combine, report.

After a short briefing, the facilitator guide runs the investigation in four timed parts, with coaching throughout.

01

Brief

Each team enters with its own code, works through a short tutorial and reads the whistleblower’s email. The government’s official denial waits at the top of the evidence drive.

02

First look · 10 min

Teams map how the evidence is organised and spot the themes running through it, such as the rural–urban divide and family ties to contractors.

03

Explore the data · 20 min

At least three calculations per team, comparing actual against expected: completion rates, cost per school, administration against construction.

04

Find the gaps · 10 min

Teams name what should be in the files but isn’t, and what it would take to prove misconduct rather than suspect it.

05

Brief the newsroom · 15 min

Teams combine their findings into one briefing: the core problem, the evidence, the human impact and recommended action.

06

Coach throughout

The facilitator watches for set triggers, such as a team calculating a completion rate without noticing the urban–rural gap, and steps in with a question rather than an answer.

Design decisions

Every mechanic has a job.

The simulation trains a way of working, not a set of answers. Each feature makes participants practise one part of it.

DecisionWhat it trainsIn the simulation
Split the evidence across five teams Synthesis. No team can tell the story alone, so findings have to be shared and reconciled. Community Impact, Construction Oversight, Financial Crimes, Geographic Justice and Procurement each hold their own folder. The explorer opens one folder at a time.
Put the official line beside the leak Weighing a government’s claims against its own records, under the pressure of legal threats. A joint statement from the Presidency and the Ministry of Education rejects the allegations and warns the media off.
Reward ratios, not big numbers Comparing actual with expected instead of reporting the largest figure. A built-in calculator, and a rubric that grades how many key ratios a team gets right. The main contractor was assigned 35 schools and finished 8.
Give the numbers a face Connecting money to consequences for children. Mario’s village school closed in 2019. Since 2020 its children have walked 12 km a day to the nearest school.
Leave deliberate gaps Saying what evidence is missing, and what would strengthen the case. No independent audits, inspection reports or community consultation appear anywhere in the files.
Use a familiar desktop Lowering the barrier for participants at any level of digital skill. A Mac-style desktop with a USB drive, calculator and email, titled in English and Urdu. It runs in a browser with nothing to install.
Evidence

What was measured

The simulation ran inside the Karachi programme’s in-person week, and every survey respondent was satisfied with that workshop. During the session, the facilitator guide’s three-level rubric and coaching triggers are used to judge the quality of each team’s analysis.

Limits

What the evidence can’t show

Results for the simulation were not reported separately from the wider workshop, so the survey can’t show what it added on its own. Across the programme, only 60% of participants agreed there was enough time for practice and questions, which points to the main change for future cohorts: more practice time.

Supporting artifacts

Explore the work.

Open the project video ↗
Start a conversation

Build the capability.
Make it work in practice.

Learning strategy, institutional systems and decision practice.

sethnguna@gmail.com ↗