Four teams of journalists take one dataset on Chinese development finance in the Philippines, each through a different lens. A shared four-step method takes them from what the data covers to a visual story they have to defend in front of the room.
Ten journalists from Manila-area media outlets and journalism schools
Setting
The in-person week of AidData’s first data journalism course with Rappler, in Rappler’s Manila newsroom, late 2024
Format
Facilitated; four specialist teams; a four-step analysis method; team presentations
Data
AidData’s Global Chinese Development Finance Dataset, version 3.0: projects in the Philippines, 2000–2021
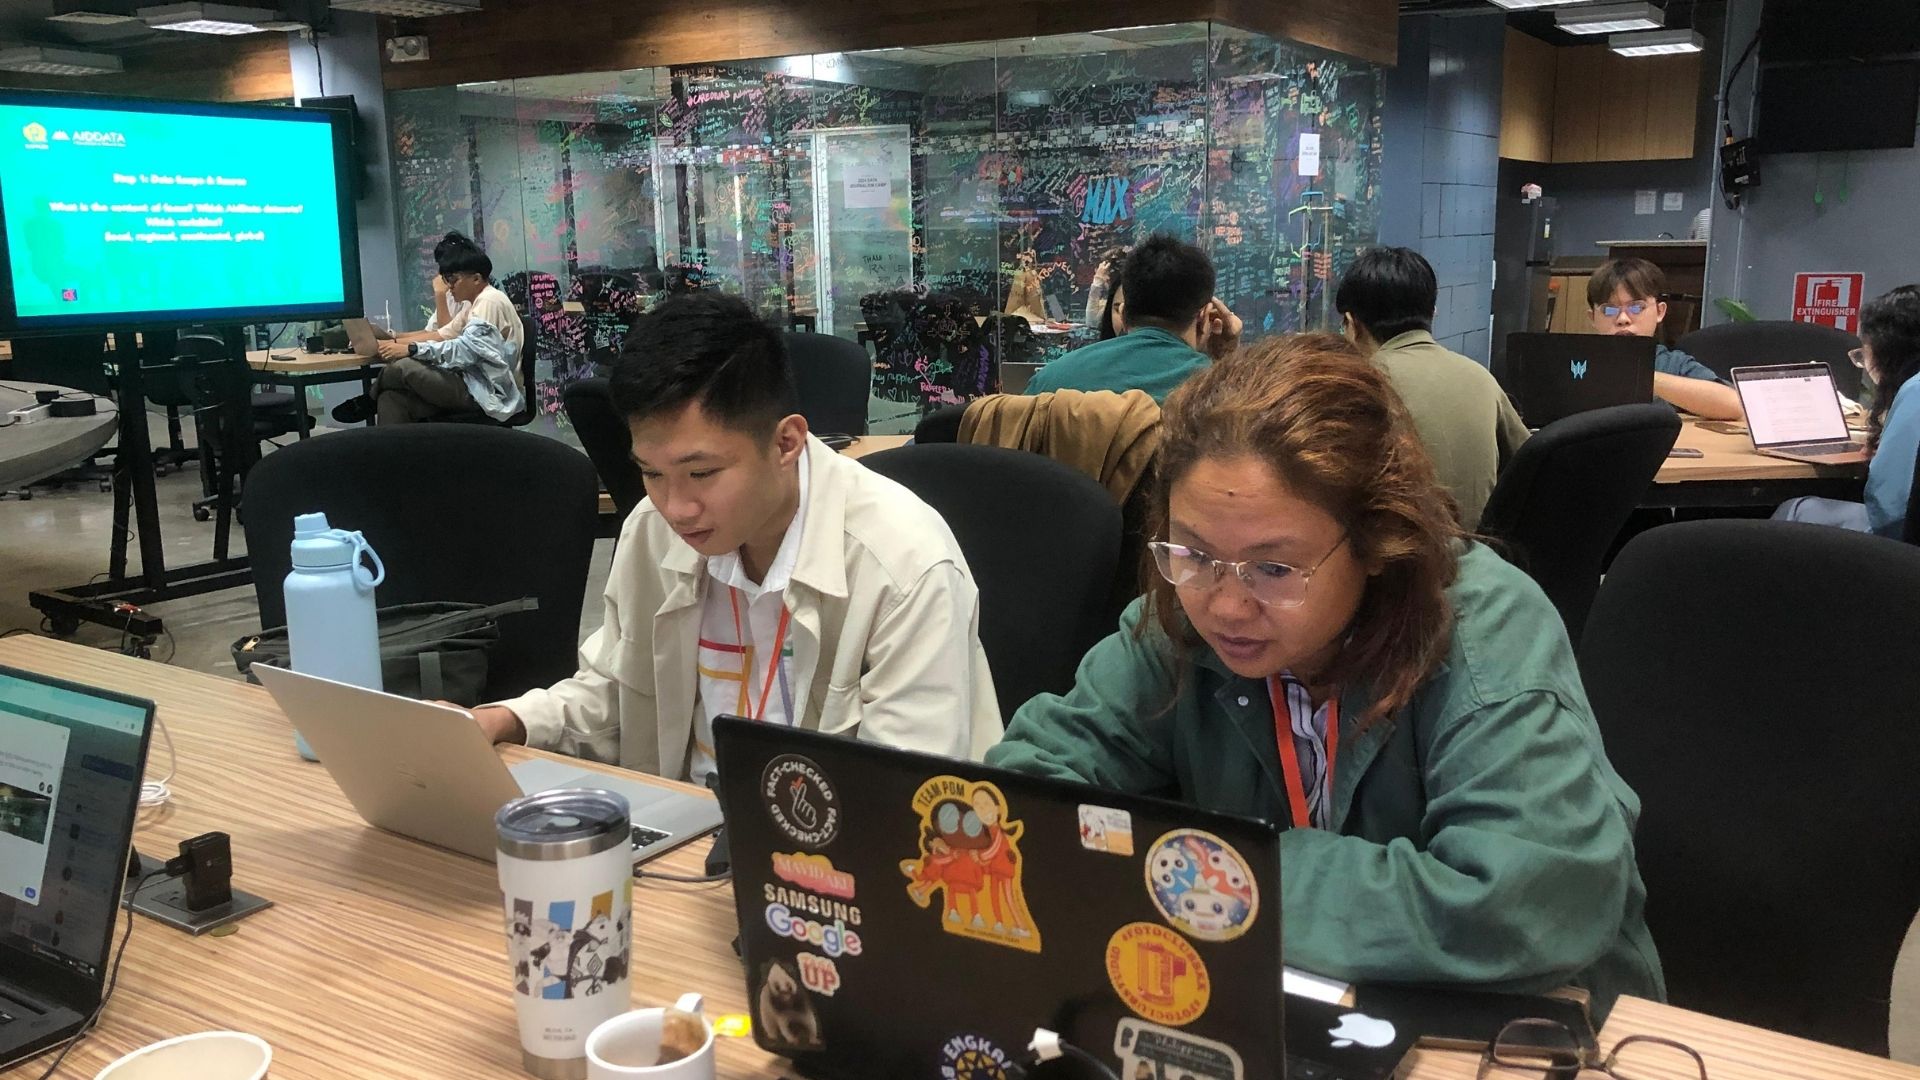
Journalists at work during the in-person week in Rappler’s newsroom, Manila, 2024.
The design problem
The challenge
Each journalist applied with a proposed feature on development finance and foreign aid, particularly involving China. The workshop had to get them from a large, project-level dataset to a story a reader would follow, without turning the week into a statistics course.
The logic
Give each team one lens on the same dataset and the same four-step method. Teams go deep on one angle, then test their reading against the others when they present. The detective framing builds on what journalists already do: investigate, question sources and follow the evidence.
What teams produce
A visual story for a named audience, presented to the room with the analytical choices behind it explained and defended.
My role
I designed the Development Data Detectives activity and co-instructed the course with Alex Wooley, AidData’s Director of Partnerships and Communications, alongside Rappler’s investigative and data journalists.
The course around it
Online first
A two-week online component on AidData’s new learning management system, built with William & Mary’s Studio for Teaching & Learning Innovation, plus two live online sessions.
In the newsroom
An intensive in-person week in Rappler’s newsroom. Development Data Detectives was the week’s team analysis exercise, run alongside sessions led by Rappler’s journalists.
After the week
The next phase asked participants to submit capstone features to AidData for feedback and possible follow-on funding to finish and publish them.
How the activity runs
Scope, analyse, refine, visualise.
Every team follows the same four steps on its own slice of the data, then presents.
01
Scope & source
Teams establish the context, the datasets and the variables before making any claim about what the data shows.
02
Analyse
Teams look for trends and patterns in their area and check the data for consistency.
03
Refine
Teams decide who the story is for and which findings are useful to that audience.
04
Visualise
Teams choose chart types, decide what to emphasise and shape the visual for their audience.
05
Present & defend
Each team presents its story and explains the analytical choices behind it to the rest of the room.
Design decisions
Every step has a job.
The activity trains a repeatable newsroom workflow, not a one-off chart.
Decision
What it trains
In the activity
Four specialist teams, one dataset
Depth on one angle, and seeing the same data through other lenses.
Environmental and climate impact; social impact and cultural heritage; economic sectors and investment; infrastructure and transportation.
Start from scope and source
Knowing what a dataset covers before claiming anything from it.
Step one asks for context, datasets and variables before any analysis begins.
Check for consistency
Treating anomalies as questions, not stories.
Step two pairs trend-spotting with a consistency check on the records.
Refine for an audience
Choosing what a reader needs, not everything the data shows.
Step three asks who the stakeholders are and what is useful to them.
Present and defend
Explaining analytical choices under peer challenge.
Teams present to the room and answer for the choices behind their visuals.
Real data on a live beat
Transfer to the newsroom.
AidData’s data on Chinese-financed projects in the Philippines, the same subject as participants’ own feature pitches.
Evidence
What’s documented
The course was the first practical application of AidData’s Training Initiative. AidData’s published account of the course reports that the pilot showed how the curriculum worked at both broad and detailed levels, and where it needed to improve.
Limits
What the evidence can’t show
AidData’s account covers the course as a whole and doesn’t report results for this activity on its own. No assessment results have been published for it.